Introduction
Curiosity about whether feeding cannabis plants fermented fruit juice (FFJ) can change the flavour and quality of hash rosin sparked Hashtek’s 2024–25 Fruit Ferment Experiment. Two identical 3 × 6 ft living‑soil beds were prepared in a 9 × 9 ft indoor grow room, each planted with a genetically identical clone of Tallyman (Oni Seeds Co.). Both beds received identical soil amendments and lighting (a 600‑W high‑pressure sodium light surrounded by LEDs totalling 2 000 W) so that the only experimental variable was the feed . According to the experimental protocol, Bed A served as the control, receiving simple sugar water, while Bed B was fed fermented fruit juice during all eight weeks of flowering . Plants were harvested at the same time, processed into rosin using identical techniques and then analysed by a certified lab to measure cannabinoids and terpene profiles . The experiment was followed up with a single‑blind sensory trial involving 30 participants across Canada , providing both quantitative lab data and qualitative consumer feedback on the rosin produced.
Methods
Cultivation & FFJ Feeding Protocol
- Plant material & environment: Two beds were filled with living soil and planted with Tallyman clones from the same mother. Soil nutrient profiles were balanced before transplanting . Lighting consisted of a 600‑W HPS lamp flanked by LEDs delivering an additional 2 000 W, and light intensity was equalised with a lux meter .
- Control vs FFJ: Bed A (control) was fed simple sugar water, while Bed B (FFJ) received 40 g of homemade fruit ferment each Monday during flowering . Both feeds were stopped in the final week before harvest. Plants were monitored throughout for health and uniformity, harvested simultaneously and processed into hash rosin using consistent washing and pressing protocols .
- Chemical analysis: Rosin from each bed was sent to High North Labs for Certificates of Analysis (COAs) measuring cannabinoids and terpene content .
Sensory Trial Design
To complement the lab data, Hashtek conducted a single‑blind sensory evaluation. Thirty hash connoisseurs across Canada were recruited and given two unlabelled jars (Sample A and Sample B). Participants used a standardized questionnaire modelled after respected hash competitions such as the Smoking Jacket to rate each sample on a 1–5 scale for appearance, aroma intensity, aroma complexity, flavor intensity, flavor complexity, vapor smoothness, aftertaste, effect and overall impression . They were also asked which sample they preferred and which they believed was the FFJ‑fed rosin. Responses were collected via Google Forms .
Results
Chemical Findings
The COAs revealed subtle but notable differences between the control and FFJ‑fed rosins. The sugar‑fed sample contained slightly more total cannabinoids (90.91 %) and THCA (83.18 %), while the FFJ sample measured 89.48 % total cannabinoids and 79.11 % THCA . Conversely, the FFJ rosin had significantly higher CBGA (7.30 %), a cannabinoid associated with therapeutic properties and unique flavour . Terpene analysis showed that the control rosin exhibited higher total terpenes (7.50 %) dominated by β‑myrcene, contributing earthy, musky notes, whereas the FFJ rosin had 6.98 % total terpenes with elevated limonene levels, yielding a brighter, citrus‑forward profile . Despite the lower terpene percentage, testers described the FFJ rosin as rounder and more complex than its sugar‑fed counterpart .
Sensory Ratings
Figure 1 contrasts the mean scores for each sensory category. Remember that Sample A is the control and Sample B is the FFJ‑fed rosin. Participants rated the control rosin slightly higher in appearance and vapor smoothness, whereas the FFJ rosin scored higher in aroma intensity, aroma complexity, flavor intensity and flavor complexity. Ratings for aftertaste, effect and overall impression were nearly identical between samples. Notably, 59 % of participants guessed that Sample A was the FFJ sample, but in reality the FFJ‑fed rosin was Sample B; only 41 % guessed correctly .
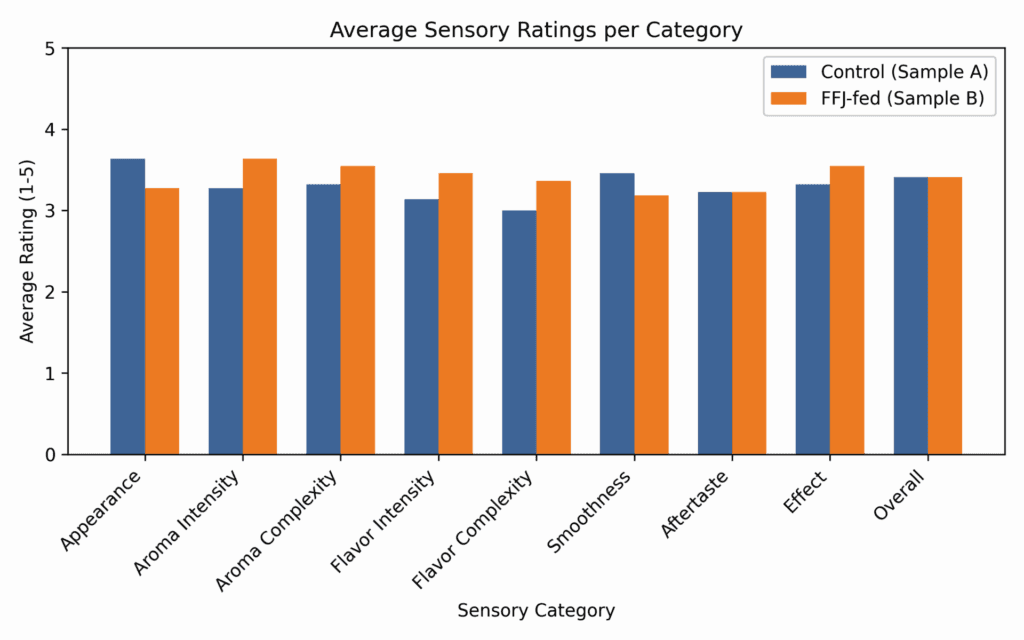
Figure 1. Bar chart of average ratings (1 = poor; 5 = excellent) by category. Each column represents the mean score across the 22 participants for the control rosin (blue) and FFJ‑fed rosin (orange). Error bars represent ±1 standard deviation. The control sample displayed slightly better appearance and smoothness, while the FFJ sample showed higher aroma and flavor scores. None of the differences reached statistical significance (Wilcoxon signed‑rank test, p > 0.05) (Table 1).
Distribution of Scores
To explore variability, we plotted the full distribution of ratings. Box plots (Figure 2) show that both samples received ratings spanning the 2–5 range in most categories. The control sample’s distribution in flavor‑related categories skews slightly higher, while the FFJ sample shows fewer low outliers in smoothness and appearance.
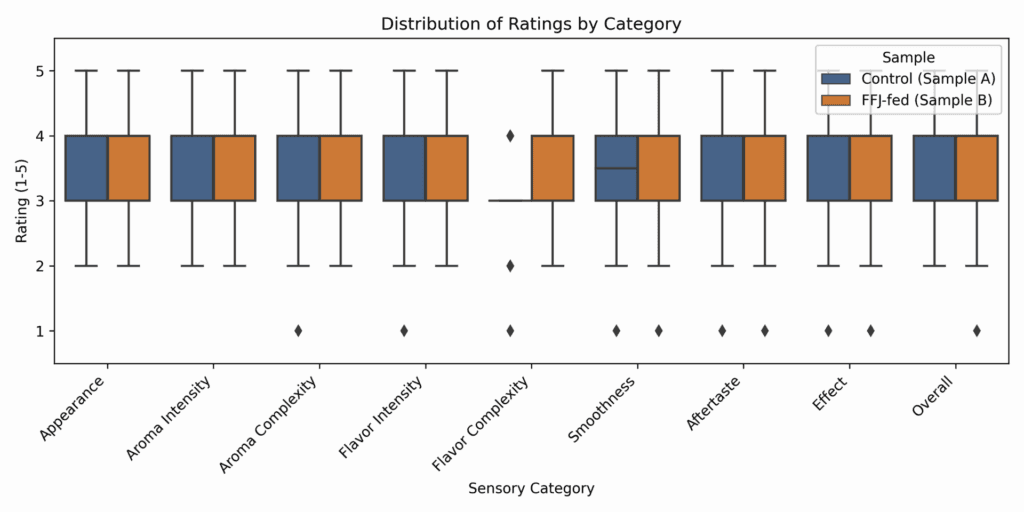
Figure 2. Box plots of participant ratings. Boxes denote the interquartile range (IQR), whiskers extend to 1.5× IQR, and points represent outliers. Overlapping IQRs indicate substantial inter‑individual variability.
Overall Sensory Profiles
The radar chart in Figure 3 summarizes the mean sensory profile for each sample. The FFJ‑fed rosin forms a polygon that bulges in appearance and smoothness, whereas the control rosin bulges in aroma and flavor intensity. Both samples converge in aftertaste and overall impression, reflecting participants’ overall similarity in perceived quality.
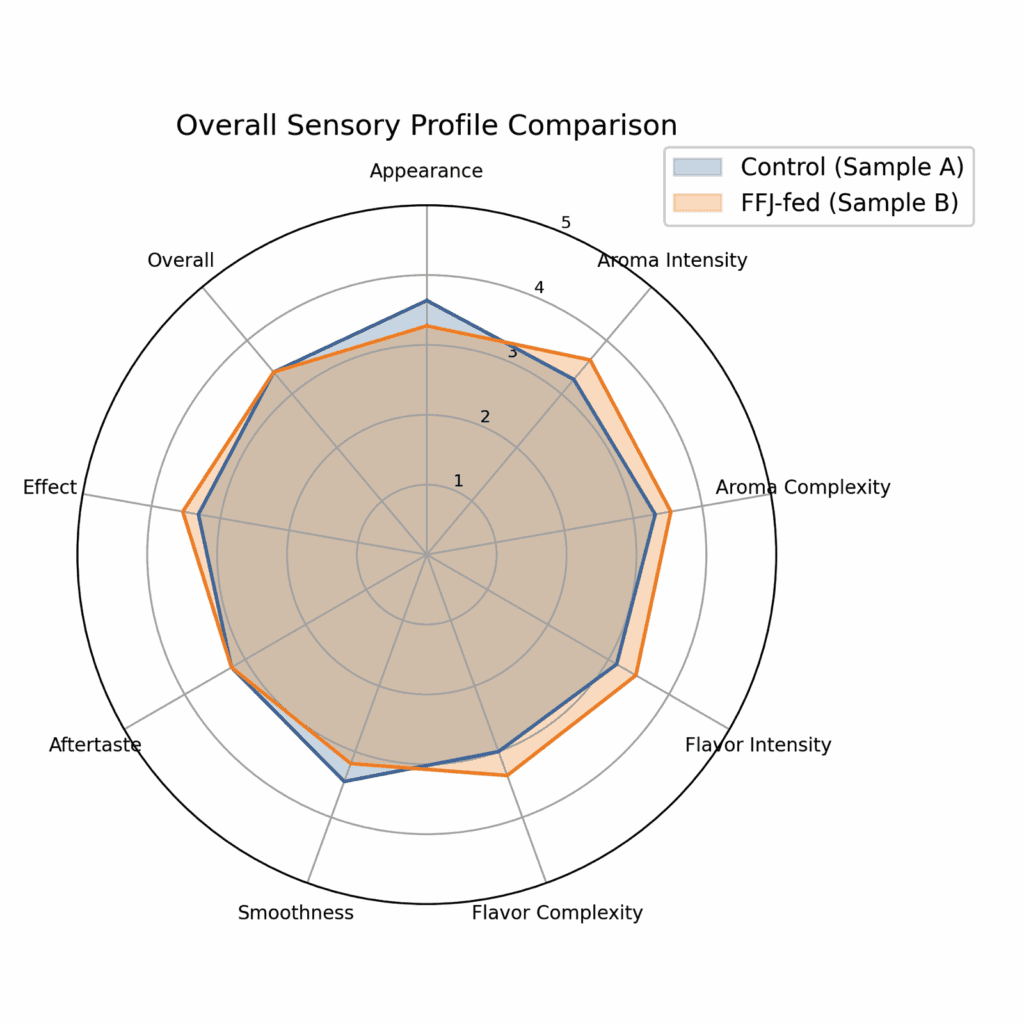
Figure 3. Radar plot of average ratings. Values are plotted on a 1–5 scale, with the outer ring representing a score of 5. The shapes illustrate how each sample performs across categories.
Preference & Guess Patterns
Participants were evenly split in their overall preference: 11 preferred Sample A (control) and 11 preferred Sample B (FFJ) (Figure 4). When asked to guess which sample was fed fermented fruit juice, 59 % chose Sample A—but this was incorrect, as the FFJ‑fed rosin was Sample B. Only 41 % correctly identified the FFJ sample. This suggests that the qualitative differences imparted by the ferment were subtle and not obvious to most testers.
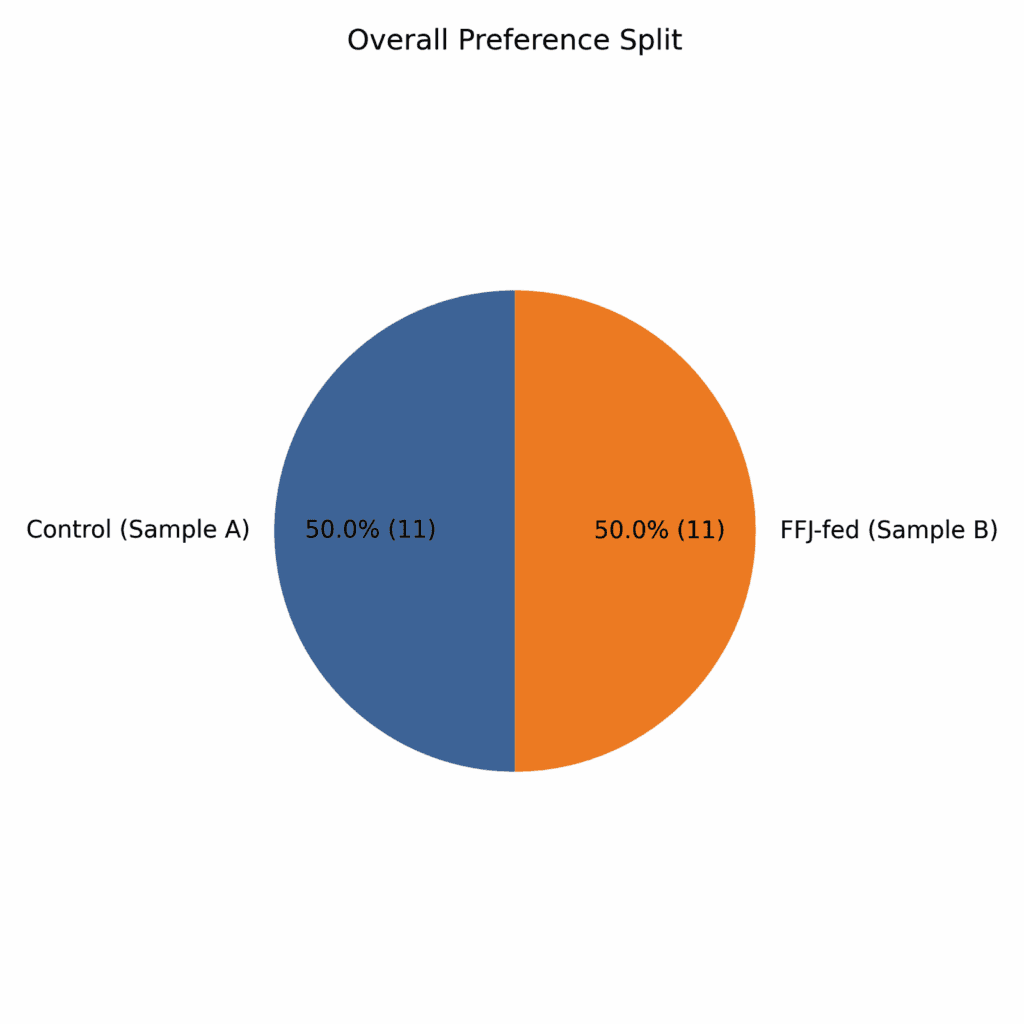
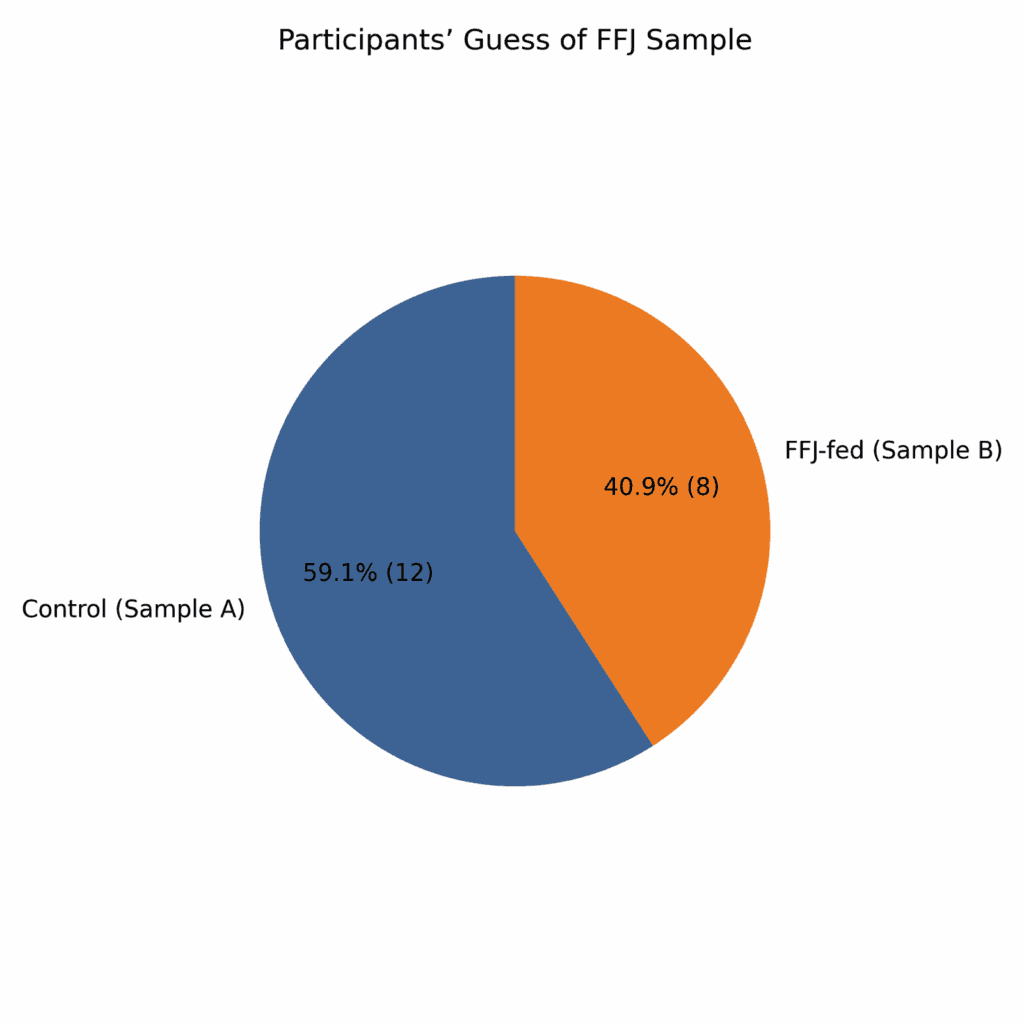
Figure 4. Preference and identification. Left pie chart: equal split between Sample A (control) and Sample B (FFJ). Right pie chart: a majority guessed that Sample A was FFJ, but the fermented sample was actually Sample B.
Statistical Significance
The paired, non‑parametric Wilcoxon signed‑rank tests (Table 1) indicate that none of the category differences reached conventional significance (p < 0.05). Appearance showed the lowest p‑value (p ≈ 0.064), suggesting a trend toward improved visual appeal in the FFJ sample, while other categories exhibited p‑values far above 0.1. This is not surprising given the small sample size (22 respondents) and ordinal nature of the ratings.
| Sensory category | Mean (Control) | Mean (FFJ) | Wilcoxon statistic | p‑value |
|---|---|---|---|---|
| Appearance | 3.64 | 3.27 | 10.0 | 0.064 |
| Aroma intensity | 3.27 | 3.64 | 69.5 | 0.158 |
| Aroma complexity | 3.32 | 3.55 | 73.0 | 0.569 |
| Flavor intensity | 3.14 | 3.45 | 46.0 | 0.410 |
| Flavor complexity | 3.00 | 3.36 | 41.5 | 0.280 |
| Smoothness | 3.45 | 3.18 | 59.5 | 0.410 |
| Aftertaste | 3.23 | 3.23 | 45.0 | 0.971 |
| Effect | 3.32 | 3.55 | 12.0 | 0.190 |
| Overall impression | 3.41 | 3.41 | 68.0 | 1.000 |
Table 1. Mean scores and Wilcoxon signed‑rank test results. Differences did not achieve statistical significance at α = 0.05.
Yield and Production Metrics
Yield data from the initial experiment (which involved only two plants) showed that the FFJ‑fed plant produced 52.8 g of rosin from 2 130 g of biomass (2.48 % yield), while the control plant produced 31.7 g from 2 000 g (1.58 % yield) . Although the FFJ plant also had slightly more starting material, the rosin yield per gram of biomass was 66 % higher in the FFJ treatment . These differences suggest that ferments may boost resin yield, but the sample size (one plant per treatment) limits generalisability.
Discussion
Linking Chemistry to Sensory Perception
The lab data highlight subtle chemical differences: the control rosin contained more total cannabinoids and was dominated by β‑myrcene, while the FFJ rosin contained more CBGA and limonene . β‑Myrcene contributes earthy, musky aromas and may explain why the control sample scored higher in aroma and flavor intensity, whereas limonene offers bright citrus notes and could contribute to perceived complexity. CBGA is a precursor to other cannabinoids and may modulate terpene perception, potentially influencing effects.
Mouthfeel appears highly subjective. The original blog commentary noted that the FFJ rosin felt rounder and smoother despite lower total terpenes ; however, our blind panel rated the control sample slightly smoother on average. This underscores the nuance of resin quality: richness of flavour and smoothness are not purely functions of total terpene percentage but arise from terpene ratios, cannabinoid composition and their synergy.
Sensory Insights
Participants’ comments (not presented here individually) frequently described Sample A (control) as “smoother on the throat” with a wetter texture, while Sample B (FFJ) was noted for its strong nose and sharper flavour. The equal overall preference split suggests that some consumers prioritise smoothness and mouthfeel (control) while others favour potency and intensity (FFJ). Most participants misidentified which jar contained FFJ, indicating that the sensory differences were nuanced rather than obvious.
Limitations
- Small sample size: The cultivation portion involved only two plants—one per treatment—so yield and chemistry comparisons lack statistical power . Similarly, only 22 of the 30 recruited tasters completed the sensory questionnaire.
- Non‑identical conditions: Although light intensity was equalized with a lux meter, the two light fixtures were from different brands and the soil beds were not perfectly identical . These factors could contribute to observed differences.
- Single‑blind sensory design: While testers didn’t know which sample was which, the researchers did, introducing potential bias . A double‑blind protocol would further minimise expectations.
- Ordinal data & non‑parametric statistics: Ratings on a 1–5 scale are ordinal and may not capture subtle differences. The Wilcoxon test used here is conservative, and larger samples may reveal significant effects.
Future Directions
Building on these preliminary findings, future experiments should:
- Increase replication: Use multiple plants per treatment and replicate across runs to achieve statistical power. Smaller, uniform soil pots could help standardise growing conditions .
- Standardise lighting: Adopt identical LED fixtures or partner with a light sponsor to eliminate spectral variability .
- Double‑blind taste panels: Remove any subconscious bias by blinding both participants and administrators.
- Quantify biomass yield variance: Record yields from several plants per group and report mean ± confidence intervals, clarifying whether higher rosin yield persists at scale.
- Explore ferment recipes: Compare different fruit ferment blends or local vs exotic ingredients, and monitor how fermentation length and feed timing influence cannabinoid/terpene production.
Conclusion
The Hashtek Fruit Ferment experiment provides a fascinating glimpse into how fermented inputs might influence resin chemistry, yield and sensory quality. The control rosin exhibited slightly higher cannabinoid and terpene numbers and was perceived as smoother and more visually appealing, whereas the FFJ rosin delivered bolder aroma and flavour but a bit less smoothness. Blind tasters were evenly split on preference, and most misidentified which jar contained FFJ, suggesting that the sensory differences were nuanced rather than dramatic. Nevertheless, the FFJ plant yielded considerably more rosin, and the ferment seemed to imbue a distinctive citrus‑forward profile. Larger, more controlled studies are needed to draw firm conclusions, but these early results suggest that fermented feeds could be a valuable tool for hashmakers seeking nuanced profiles and improved yields.